
Worth noting for #GoogleMaps users... It has been clear to me for some time that #Google is using machine learning algorithms (sometimes called "AI") to adjust boundaries of geographic features. I assume they run an #ML model over satellite photos to do this. Here's a example of it failing, badly. The first picture attached is a Google Map of an urban creek in my town, with a street just north of it. Note how Google shows the creek not going anywhere near the street. The second picture is a topographic map of the same area. Notice how the creek ACTUALLY goes much farther north than Google depicts. For creeks and bodies of water I've noticed this most often happens where there is an adjacent #FloodPlain that the creek spills into on occasion. Clearly Google's algorithm is noticing water during flood conditions, or breaks in the tree line, and "learning" that the creek has moved. (In their defense, it is quite unusual that this urban creek passes directly under an office building parking deck, which probably also played a part. But why use ML to do this stuff when #topographic data exists?) #AIFails #AIFailures
#topographic


You know why Trump is flailing about with his international bullying and adventurism, a way too polite way of describing his mental deterioration, his brain literally turning to shit, if he were your dad you would have long ago taken the car keys away? You know why? #TrumpEpsteinFiles #Epsteinezuela #GreenEpsteinLand
#topographic or #pedophilographic, you judge.


Sometimes an overedge catches the eye while flipping through a #topographic set. #Sublime #cartography MYGGENÆS (M 23) 1974 : Danmark, Faeröerne 1:20,000. archive.org/details/WCWd... #overedge the #neatline #Slumbufles
![[map portion] showing sheet : MYGGENÆS (M 23) 1974. From the Danmark, Faeröerne 1:20,000 scale series. Publisher: Geodaetisk Institut](https://files.mastodon.social/cache/media_attachments/files/116/030/915/775/875/954/original/5205c90accc7c156.jpeg)
![[map portion] showing sheet : MYGGENÆS (M 23) 1974. From the Danmark, Faeröerne 1:20,000 scale series. Publisher: Geodaetisk Institut](https://files.mastodon.social/cache/media_attachments/files/116/030/915/917/046/472/original/5565b7801c96252a.jpeg)
![[map portion] showing sheet : MYGGENÆS (M 23) 1974. From the Danmark, Faeröerne 1:20,000 scale series. Publisher: Geodaetisk Institut](https://files.mastodon.social/cache/media_attachments/files/116/030/916/028/074/410/original/2c3e87f5780db834.jpeg)
![[map portion] showing sheet : MYGGENÆS (M 23) 1974. From the Danmark, Faeröerne 1:20,000 scale series. Publisher: Geodaetisk Institut showing Slumbufles Island.](https://files.mastodon.social/cache/media_attachments/files/116/030/916/142/639/951/original/8535ab9e91e15e90.jpeg)

USGS topoBuilder Milestone of 1 Million Maps Delivered
--
https://www.usgs.gov/programs/national-geospatial-program/topobuilder <-- USGS topoBuilder Open Source / Open Data creation page, make your own custom USGS ‘topo map’!
--
“Each year, [the #USGS has] seen steady growth in map requests, underscoring the public’s trust and appreciation for these innovative products.
This [USGS topoBuilder Milestone of 1 Million Maps Delivered] is a testament to the dedication and expertise of colleagues across the National Geospatial Program and the National Geospatial Technical Operations Center. The success of topoBuilder is built on the collective efforts behind The National Map...
[The USGS] has modernized and advanced #topographic mapping…”
#GIS #spatial #mapping #NGP #NGTOC #usecase #fedscience #fedservive #topomap #ondemand #custom #USGS #topobuilder #opendata #publicservice #publicgood #milestone #TNM #NationalMap #free #recreation #usecase #agriculture #hiking
@USGS


In 1 week, @esri webinar: Modernizing #Topographic Production with #ArcGIS https://tinyurl.com/4bhc9s9d
#mapping #maps #cartography #GIS #esri #GISchat #geospatial @esrifederalgovt @esrislgov @arcgispro @arcgisxprise @esritraining @urisa

Introducing #ArcGIS #Topographic #Mapping: A unified extension designed for you https://tinyurl.com/44a8bmf5
#defense #production #maps #series #GIS #esri #cartography #GISchat #geospatial @esri @esrifederalgovt @esritraining @arcgispro @arcgisxprise @urisa


@pinakographos the Rightmost one, the dark mountain #topographic textures. And the second from the left, the green colored #ocean texture with waves looks cool, though I assume this is an artistic choice with no information content for the map?

I attended a school for #blind and #LowVision students for grades 8-10.
We had large, wooden #topographic and #Political maps of #Europe and the #USA. They were basically giant #puzzles.
Europe was made/acquired between #WWI and #WWII. In ninth grade, our World History teacher would sometimes quiz us. This why I can identify #Latvia, #Estonia, and #Lithuania. Same teacher read us All Quiet on the Western Front, and shared this: https://en.wikipedia.org/wiki/Der_Fuehrer%27s_Face#Song.

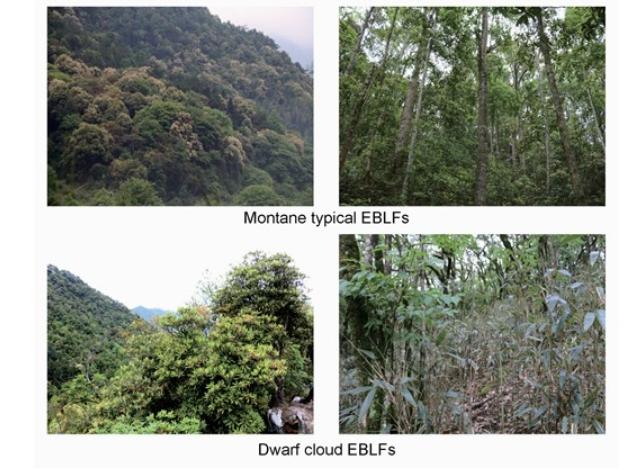
#EvergreenBroad-leavedForest ( #EBLF ) is climax vegetation in East China, and Jiangxi Province is located at the center of EBLF. In this study, Yizhen Liu et al. provided a high-level #ClassificationFramework for EBLF in #Jiangxi and exploring the roles of #Topographic and #Climatic factors in driving their distributions.
https://doi.org/10.1093/jpe/rtac059
Updates To New Zealand Topo50 Map Coverage - Toitū Te Whenua Land Information New Zealand
--
https://www.linkedin.com/posts/toit%C5%AB-te-whenua-linz-_our-talented-cartographers-have-been-busy-activity-7274891422502195200-mCGe <-- shared post
--
https://www.linz.govt.nz/products-services/maps/new-zealand-topographic-maps/topo50-map-chooser <-- Topo50 NZ Map Chooser
--
https://www.linz.govt.nz/products-services/maps/new-zealand-topographic-maps/topo50-map-chooser/topo50-map-bs24-mount-robert <-- Topo50 map example - BS24 - Mount Robert
--
H/T Toitū Te Whenua Land Information New Zealand
#GIS #spatial #mapping #map #papermap #geotiff #opendata #NewZealand #coverage #usecase #Topo50 #download #topographic #AI #machinelearning #emergencyresponse #planning #urbanplanning #tramping #tourism #leisure
@Toitū Te Whenua Land Information New Zealand @LINZ


Integrated Topographic Corrections Improve Forest Mapping Using Landsat Imagery
--
https://doi.org/10.1016/j.jag.2022.102716 <-- shared 2022 paper
--
“HIGHLIGHTS:
• [They] evaluated the impacts of topographic correction on forest mapping in the mountains.
• The enhanced C-correction and the physical model reduced topographic effects.
• The corrected Landsat imagery time series resulted in higher accuracy.
• Terrain information improved classification but not as much as topographic correction.
• [They] recommend using topographic correction for forest cover mapping..."
#GIS #spatial #AtmosphericCorrection #IlluminationCondition #LandCover #ModelComparison #TimeSeries #TopographicCorrection #remotesensing #comparasion #topographic #correction #NDVI #forest #vegetation #model #modeling #spatialanalyis #accuracy #forestcover #Russia #Georgia #CaucasusMountains #spatiotemporal #landsat #elevation #DEM


![map - Forest cover classification agreement among the 18 sets of input variables. Pixels in red color were classified by all sets of input variables as coniferous, in green color as broadleaf forest, and in blue color as mixed forest. Black color indicates that no forest was predicted by any set of input variables. Two subsets A and B which are marked in white frames were zoomed in for a detailed map comparison in [another figure]](https://files.mastodon.social/cache/media_attachments/files/113/587/533/215/723/867/original/3d9c91a8d441df54.jpg)
USGS Releases New Topographic Maps For Puerto Rico & The U.S. Virgin Islands – Updated Maps For Essential Needs
--
https://www.usgs.gov/programs/national-geospatial-program/news/usgs-releases-new-topographic-maps-puerto-rico-and-us <-- shared article
--
https://apps.nationalmap.gov/downloader/ <-- USGS National Map Downloader
--
https://www.usgs.gov/programs/national-geospatial-program/topobuilder <-- USGS OnDemand Topo
--
#GIS #spatial #mapping #cartography #PuertoRico #USVI #USVirginIslands #topomaps #20K #UStopomaps #topographic #map #NationalMap #TheNationalMap #TNM #NationalMapCorp #volunteers
@USGS


Guide to make #SVG topo #maps in Inkscape 🧭🗺️
https://tech.michaelaltfield.net/2024/10/01/osm-contours-svg-maperitive/
Ever wanted to make your own infinitely-scaleable #topographic #map (eg to hang on the wall)? This guide shows how with #Linux, @openstreetmap, @inkscape, #JOSM, #OsmAnd, and #Maperitive 🎨🖼️
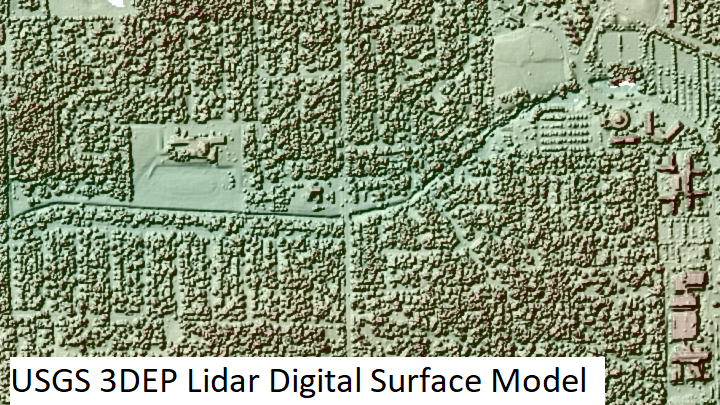
USGS 3DEP LiDAR Collection @ Microsoft
--
https://planetarycomputer.microsoft.com/dataset/group/3dep-LiDAR <-- Microsoft data / use case portal
--
“To respond to growing needs for high-quality elevation data, the goal of 3DEP is to complete acquisition of nationwide lidar (IfSAR in AK) to provide the first-ever national baseline of consistent high-resolution topographic elevation data – both bare earth and 3D point clouds. This dataset provides the raw 3D point clouds in the Cloud Optimized Point Cloud format, and various derived products as Cloud Optimized GeoTIFFs…”
#GIS #spatial #mapping #gischat #3dep #elevation #opendata #planetarycomputer #LiDAR #ifsar #USA #nationwide #acquistion #topography #topographic #dem #bareearth #pointclouds #cloudoptimization #geotiffs #download #library #usgs #microsoft
@microsoft @usgs


Today's crafty submission for the #30DayMapChallenge. I upcycle jars with historical topographic maps from various sources. This is from a USGS 1:62,500-scale Quadrangle for Charleston, WV 1936.
#30DayMapChallenge #Day5 #topographic #topography #USGS #craft #historicaltopographicmap #historicalmap #upcycle #Charlestonwv #WestVirginia
Moon LiDAR!
--
https://moonlidar.com/ <-- shared webmap
--
https://lunar.gsfc.nasa.gov/lola/ <-- NASA’s LOLA mission page
--
"The Lunar Orbiter Laser Altimeter (LOLA) has collected and released almost 7 billion individual laser altimeter returns from the lunar surface. The LOLA data is used poleward of 79◦latitude as the elevation basemap necessary for calculating shading…”
--
“The Lunar Orbiter Laser Altimeter (LOLA) provides a precise global lunar topographic model and geodetic grid that serves as the foundation of essential lunar understanding.
This aids future missions by providing topographical data for safe landings and enhance exploration-driven mobility on the Moon. LOLA also contributes to decisions as to where to explore by looking at the evolution of the surface…”
#GIS #spatial #mapping #gischat #LiDAR #solarsystem #moon #lunar #remotesensing #elevation #LunarOrbiterLaserAltimeter #LOLA #opendata #DEM #DTM #topographic #topography
@nasa @hobu @CRREL @USGS @USACE


Historical Topo #Map Explorer (beta) in #ArcGIS Living #Atlas https://tinyurl.com/ycks2k5d
#data #LivingAtlas #mapping #maps #cartography #GIS #esri #arcgis #ArcGISOnline #GISchat #geospatial #topographic #mapstodon
Instructional Videos on Using [USGS’s] The National Map [Open Data] Products and Services [3DEP Elevation, Hydrology, etc]
--
https://www.usgs.gov/programs/national-geospatial-program/training <-- shared technical training resource
--
https://www.usgs.gov/programs/national-geospatial-program/national-map <-- background to the USGS’s Accessible National Map Open Data
--
#GIS #spatial #mapping #USGS #opendata #elevation #hydrography #hydrology #NGTOC #NGP #3DEP #3DHP #topoBuilder #USA #gischat #TNM #TheNationalMap #products #services #dataportal #tutorials #tutorial #trainingvideos #videos #learning #continuingeducation #education #educationandtraining #free #videolessons #videolearning #topographic #topographicmaps #instructional #onlineclasses #onlineeducation #onlinelearning
@usgs


@SrRochardBunson@firefish.social
New images, hot off the digital presses!
These are from a DIC #Microscope.
"Attached are a couple of the record images by DIC. The Stack was 20x and the other is not stacked and 10x."

