
Map Reveals How America's Forests Have Changed Over Time
--
https://www.newsweek.com/america-forests-change-over-time-2041291 <-- shared 2025 media article
--
https://doi.org/10.5194/essd-15-1005-2023 <-- shared 2023 paper
--
https://doi.org/10.5281/zenodo.7055086 <-- shared study datasets
--
#GIS #spatial #mapping #remotesensing #spatialanalysis #spatiotemporal #copernicus #CONUS #USA #forest #model #modeling #landuse #landcover #change #forestland #agriculture #urban #development #cities #industry #vegetation #America #humanimpacts #settlement #decline #cropland #pasture #grassland #grazing #reforestation #deforestation #urbanization #conservation #ecosystems #logging #mining #railroad #infrastructure #forestcover #NLDI #farmland #colonial #LULC #census #climate #hydrology #biogeochemical
#LULC


#𝟯𝟬𝗗𝗮𝘆𝗠𝗮𝗽𝗖𝗵𝗮𝗹𝗹𝗲𝗻𝗴𝗲 - 𝗗𝗮𝘆 𝟮𝟵: 𝗥𝗮𝘀𝘁𝗲𝗿
𝘖𝘚𝘔-𝘣𝘢𝘴𝘦𝘥 𝘓𝘜𝘓𝘊 𝘮𝘢𝘱 of 𝘒𝘢𝘳𝘭𝘴𝘳𝘶𝘩𝘦, 𝘎𝘦𝘳𝘮𝘢𝘯𝘺 2021🛰️🗺️
Satellite imagery shows how our landscapes evolve. In the LaVerDi project, HeiGIT and @BKG combine OSM data with Copernicus Sentinel-2 imagery to make land-use and land-cover monitoring across Germany more precise and responsive.
🔍 More about LaVerDi: https://heigit.org/laverdi/


Here is a quick land-cover breakdown for the Carpathian National Nature Park (Ivano-Frankivsk region, Ukraine), based on Copernicus Global Land Service remote-sensing data.
The results show that closed evergreen needle-leaf forest dominates the territory (almost 60%), followed by mixed and deciduous forests. Urban areas, shrubs, and agricultural lands occupy only a tiny fraction of the park.
This is part of my long-term project of analysing protected areas using open satellite datasets and reproducible geospatial workflows.
#RemoteSensing #EarthObservation #Copernicus #LandCover #GIS
#RStats #Rspatial #Conservation #Carpathians #Ukraine #Biodiversity
#NationalParks #OpenData #EnvironmentalScience #LULC

A few years ago, I carried out a personal initiative project while working at UkrGazVydobuvannya (Oil&Gas).
In 2019–2020, I performed a full land-cover analysis for all company license areas using openly available Copernicus Global Land Cover data.
I built two variants of the analysis based on FAO UN land-cover classifications and calculated Shannon diversity indices for each license area.
Later, I expanded the work and produced detailed plots and spatial summaries for every site.
These analytics were used by both field personnel and upper management — for general environmental understanding and for environmental impact assessment (EIA) related to the company’s production activities.
Everything was done using open data and the R language.
#LandCover #Copernicus #RStats #OpenData #EnvironmentalScience #GIS #ShannonIndex #RemoteSensing #Ukraine #FOSS #DataScience #LULC #LandCover #CopernicusLandCover #Energy #UGV


My experiment with land-cover classification for Calgary using satellite imagery and with a machine-learning model trained on data from another continent.
The results turned out surprisingly good — most classes transferred almost perfectly.
The only noticeable shift was the Forest class: tree and shrub vegetation in the source region differs from Calgary’s, so the model mapped it conservatively here.
Still, the general structure of the landscape was captured very well, and community-level land-cover profiles look consistent.
#Rstats #RemoteSensing #GIS #MachineLearning #LandCover #Calgary #EarthObservation #LULC #GreennessOfCalgary #QGIS #UrbanHealth #Alberta #Canada #Sentinel #Copernicus #CopernicusSentinel #Sentinel1 #Sentinel2 #ESA #DataScience #FOSS #UrbanEcology #UrbanNature


🌳 Random Forests and Living Trees
English translation of my earlier article on applying satellite imagery and machine learning to map urban land cover.
What started as a local research project in Kryvyi Rih turned into something much larger — the results sparked a heated discussion among residents, officials, and industry representatives about the real condition of green buffers around large industrial sites.
The methodology developed during that work is still being used today — adapted for new environmental and urban projects.
🔗 https://www.datastory.org.ua/random-forests-and-living-trees/
#RemoteSensing #MachineLearning #LandCoverMapping #UrbanEcology #EnvironmentalMonitoring #RandomForest #GeospatialAnalysis #GIS #RStats #SAGAGIS #QGIS #IndependentResearch #OpenSource #EnvironmentalDataScience #KryvyiRih #LULC
𝗟𝗨𝗟𝗖 𝗖𝗵𝗮𝗻𝗴𝗲: 𝗵𝗼𝘄 𝘁𝗼 𝗰𝗮𝗹𝗰𝘂𝗹𝗮𝘁𝗲 𝗰𝗮𝗿𝗯𝗼𝗻 𝗲𝗺𝗶𝘀𝘀𝗶𝗼𝗻𝘀 𝗳𝗿𝗼𝗺 𝗹𝗮𝗻𝗱 𝘂𝘀𝗲 𝗮𝗻𝗱 𝗹𝗮𝗻𝗱 𝗰𝗼𝘃𝗲𝗿 𝗰𝗵𝗮𝗻𝗴𝗲
With the 𝗖𝗹𝗶𝗺𝗮𝘁𝗲 𝗔𝗰𝘁𝗶𝗼𝗻 𝗡𝗮𝘃𝗶𝗴𝗮𝘁𝗼𝗿, you can calculate high-resolution estimates of emissions caused by #LULC changes.
This makes it easier to plan locally targeted climate mitigation measures.
📑 Read more: https://heigit.org/unveiling-the-heigit-climate-action-navigator-part-4-land-use-and-land-cover-change-emissions/
📊 Try it out: https://climate-action.heigit.org/

Artificial area and croplands have increased by 133% and 6% between 1992 and 2020, respectively. If global land use continues to change at historical rates, global GHG emissions would increase to 76 ± 8 Gt CO2eq in 2050.
However, #ecosystem conservation and restoration can be effective strategies to partially offset GHG emissions from fossil fuel combustion.🛢️🚫
Reference: https://onlinelibrary.wiley.com/doi/10.1111/gcb.17604

#30DayMapChallenge Day 6 (Raster):
🏡Land Use & Carbon Emissions🏡
With our plugin for Land Use Land Cover (LULC) Change Emissions Estimation, we can quantify carbon emissions resulting from changes in the land use or land cover within a selected area and time period.
🔎 This map shows how #LULC changes impacted #CarbonEmissions in Heidelberg between 2017 and 2024.
🗺️ Data by #OpenStreetMap/#Esri. Map by Satvik Parashar, modified according to Ulrich et al. (2024, in submission)
🛰️ A new paper "scikit-eo: A Python package for Remote Sensing Data Analysis" on a tool for #LULC analysis with various machine learning and neural networks algorithms.🛰️
Article: https://doi.org/10.21105/joss.06692
Software: https://yotarazona.github.io/scikit-eo/


Spatial Prediction Of Soil Properties Using Random Forest, K-Nearest Neighbors And Cubist Approaches In The Foothills Of The Ural Mountains, Russia
--
https://doi.org/10.1007/s40808-023-01723-4 <-- shared paper
--
#GIS #spatial #mapping #soil #properties #environmental #water #machinelearning #ml #UralMountains #Russia #model #modeling #research #remotesensing #productivity #gauging #SOM #pH #organicmatter #organic #sampling #correlation #DEM #satellite #landcover #landuse #LULC #statistics #prediction #geostatistics #erosion #deposition #agriculture


Dynamic World, Near Real-Time Global 10 Metre Land Use Land Cover Mapping
--
https://doi.org/10.1038/s41597-022-01307-4 <-- shared paper
--
#GIS #spatial #mapping #landcover #processeddata #deeplearning #AI #landuse #remotesensing #global #timelag #automation #NRT #LULC #NLCD #satellite #Sentinel #Sentinel2 #DynamicWorld #NDVI #machinelearning #artificialintelligence #NearRealTime
review of landslide susceptibility studies focused on LULC.
The development of this study had the collaboration of researchers from ESPOL/CIPAT-ESPOL, Ecuador, Universidad de Almería, Spain,
and University of Potsdam, Germany.
Thank you very much Andrés Velástegui Montoya, Néstor Montalván, Fernando Morante-Carballo, Oliver Korup, and Camilo Daleles Rennó.
#LULC #LUCC #landslide #landslidesusceptibility #susceptibility #Disaster #review #bibliometrics #academicresearch #phd #doctorate
Diana E. Frimpong et al. (2022) assessed the relationship between land use land cover #LULC change & air quality trends over the past 30 years in East Baton Rouge, Louisiana using #Landsat5 & #Landsat8 imagery, #Sentinel5p & air quality index from the EPA. #LoLManuscriptMonday https://bit.ly/Frimpong_2022
Cheers to Diana’s co-authors and affiliated organizations for this manuscript, and thank you especially to our lead Matilda Anokye for leading this Manuscript Monday feature! #EOChat #GISChat

Here's our #introduction! We are the Global Environmental Analysis and Remote Sensing (GEARS) Laboratory, which is led by (me), Dr. Jonathan A. Greenberg. We focus on addressing questions of the impacts of #climatechange and land use/land cover (#LULC) change on vegetated #ecosystems using #remotesensing data. Our lab website is at https://www.gearslab.org

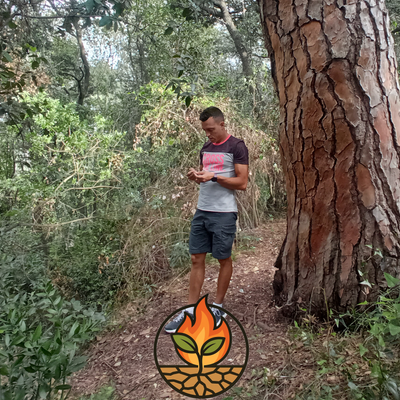
Hello!
I'm a geospatial researcher currently focusing on future scenario #GIS modelling of #urbanforestry & #urbanplanning in the elementslab @ University of British Columbia (Vancouver, Canada).
Research interests include #urbangreenness & #trees - including #health & #wellbeing implications - also #LULC, #remotesensing, #R (#posit), #GEE, + other open-source software.
I also love #gardening, #plants, #flowers, #fungi, #foraging, #diy, #art, #design, #maps!
🌳 🌿 🌻 🏙️ 🍄 🌱 🌲