#Sentinel1

Susan Villevillebooks
2026-01-24

📌 🗺️ This map illustrates the extent derived from acquired on JAN-23 2026

🔹 Within the analysed area of approx 43,500 km², an estimated 3,000 km² of land appears to be affected by floodwaters

🔹 Based on WorldPop spatial demographic , approx 230,000 people are exposed to or living in close proximity to the flooded areas


Source 🔵 UN / UNOSAT

unosat.org/products/4230

Alarmstufe Rot am Jakobshavn-Gletscher
Satellitendaten zeigen schnellen Eisabfluss des größten Gletschers Grönlands

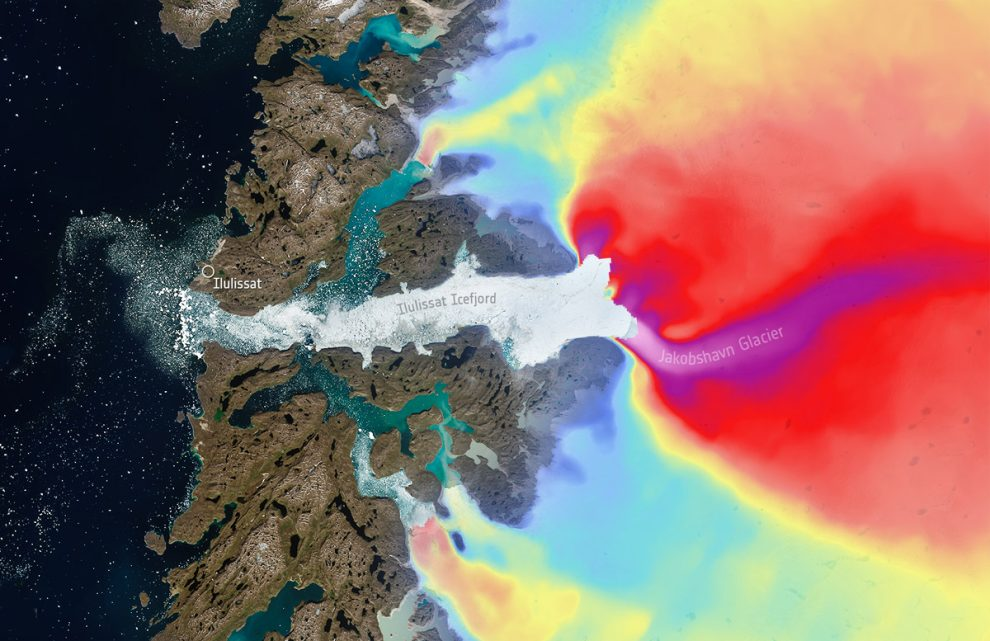
In diesem Bild ist einer der größten und am schnellsten strömenden #Gletscher Grönlands zu sehen. Die Aufnahme des europäischen Satelliten #Sentinel1 zeigt den #JakobshavnIsbræ an der Westküste #Grönland's. Das Einzugsgebiet dieses Eisstroms umfasst etwa 110.000 Quadratkilometer – dies entspricht 6,5 Prozent des grönländischen Eisschilds. Von der riesigen Gletscherfront des Jakobshavn kalben mehr #Eisberge als von jedem anderen Küstengletscher Grönlands. Auch der Eisberg, der 1912 die #Titanic versenkte, stammte wahrscheinlich vom Jakobshavn-Gletscher.

Wegen seiner enormen Eismassen und schnellen Veränderung steht der Jakobshavn-Gletscher unter ständiger Beobachtung: In regelmäßigen Abständen wird seine Oberfläche von den Satelliten der Copernicus Sentinel-1-Mission abgetastet und kartiert. Dies hat es Forschenden ermöglicht, die Geschwindigkeit dieses Eisstroms und weiterer Gletscher Grönlands in den letzten zehn Jahren genauer zu bestimmen.

Die Farben in dieser Aufnahme verdeutlichen die Resultate der Satellitenmessungen. Demnach flieĂźt das Eis in den weiĂźlich-violett markierten Bereichen des Jakobshavn-Gletschers mit bis zu 50 Meter pro Tag in Richtung Meer. In den roten Bereichen sind es immerhin noch zwischen einem und zehn Meter pro Tag.

scinexx.de/fotos/alarmstufe-ro

#Klimakatastrophe
#Kryosphäre

Der Jakobshavn Gletscher ist einer der größten und am schnellsten strömenden Gletscher Grönlands. © ESA/ Wuite, J. et al. 2025 

Dieses Farbenspiel bedeutet nichts Gutes. Denn die roten und violetten Farbtöne zeigen an, wo das Eis des Jakobshavn-Gletschers in Grönland besonders schnell fließt. Mit bis zu 50 Meter am Tag ist dieser Eisstrom der schnellste der Welt – und das ist nichts Positives. Denn je schneller das Eis in Richtung Meer strömt, desto mehr Eis verliert Grönland an dieser Stelle.

Sentinel-1's decade of essential data over shifting ice sheets

Ice velocity is a key parameter in measuring the effects of #ClimateChange. The speed at which #glaciers and #IceSheets move tells us the rate at which they discharge ice and water into the sea, feeding into estimations on future #SeaLevelRise. Data on ice velocity also help to keep track of the break-up of ice sheets, such as calving events or damage to the ice sheets.
Since its first satellite was launched in 2014, the #Copernicus #Sentinel1 mission has provided a step change in the capabilities of polar satellite Earth observation. Its 12-m-long advanced #SAR instrument works in C-band. This makes it a reliable tool for acquiring high-resolution imagery for continuous monitoring and emergency response efforts. It is able to capture data through cloud cover, smoke and during lack of sunlight.

phys.org/news/2026-01-sentinel

#ClimateScience
#RemoteSensing
#Cryosphere
#ClimateCatastrophe

Ice flow velocity on the Antarctic ice sheet, 2014–2024. Credit: European Space Agency

The data visualization of Antarctica (see image below) shows details of ice flows moving at speeds between 1 m and 15 m per day. The Sentinel-1 data is averaged over the period 2014–2024. Regions shown on the map include the Antarctic Peninsula and Alexander Island, as well as large parts of the West Antarctic Ice Sheet and East Antarctic Ice Sheet. Most of the coastal areas were captured at either six or 12-day intervals.
On the West Antarctic Ice Sheet (on the left of the image), the Pine Island Glacier is clearly visible below the Antarctic Peninsula. Over the period of the study, the velocity of ice flow at the glacier's grounding line—the point where grounded ice detaches from the bedrock underneath it and becomes a floating ice shelf—increased continuously from approximately 10.6 m per day to 12.7 m per day. Other nearby glaciers also showed increased ice flow. These changes are caused by a range of factors including ocean-induced thinning of the floating ice shelves combined with a retreat of the grounding line.Ice velocity on Greenland ice sheet, 2014–2024. Credit: ESA (Data source: Wuite, J. et al. 2025).

The study shows the rapid flow of ice, moving at average speeds of up to 15 m per day, from glaciers and ice sheets at points around the Greenland Ice Sheet (see image below). Half-way up the western coast of Greenland, Sermeq Kujalleq, also known as the Jakobshavn Glacier, is one of the fastest outlet glaciers in the world with velocities reaching, at times, as much as 50 m per day.
The North-East Greenland Ice Stream (NEGIS), is also clearly visible on the Greenland Ice Sheet and begins far inland at the "ice divide," shown as a dark blue band of nearly stagnant ice in Greenland's interior.

The dataset offers unprecedented spatial detail, with resolution up to 200–250 m, as well as timeframes for tracking movement ranging from less than a week to more than a decade.
2025-12-05

Today is #WorldSoilDay so I thought I'd share an animation of Winter Hill in the West Pennine Moors. This illustrates how #Sentinel1 #SAR satellite data can be used to delineate #peatland condition.
Turquoise denotes wetter peatland, drier areas are in brown.
Our research found frozen conditions to better differentiate peatland from other land cover & highlight relative condition. Check it out here
mdpi.com/2072-4292/17/16/2752
All with the power of #qgis #remotesensing #earthobservation #mapping

#ESA:
"
Sentinel-1D delivers first images: from Antarctica to Bremen
"
"Glaciers in Antarctica, the tip of South America, as well as the city of Bremen, .. visible in .. radar images."
".. the satellite and its instruments – it carries a 12 m-long synthetic aperture radar (SAR) instrument – were switched on .."

esa.int/Applications/Observing

26.11.2025

#Bremen #Copernicus #Elbe #EO #Erdbeobachtung #Fernerkundung #GMES #Matera #Radar #Raumfahrt #SAR #Satelliten #Sentinel1D #Sentinel1 #SpaceFlight

2025-11-20

Result of a Principal Component Analysis (PCA) created from combined median composites of Sentinel-1 and Sentinel-2 imagery — somewhere in the Sudanese desert.

This PCA composite brings out contrasts between lithologies, structural domains, drainage patterns, and surface materials, highlighting features that are nearly invisible in standard RGB representations.

And yes — it also happens to look stunning.

#RemoteSensing #EarthObservation #Geology #PCA #Sentinel1 #Sentinel2 #SAR #Radar #OpenData #GIS #QGIS #Geomorphology #Geoscience #SAGAGIS #RStats #Desert #Lithology #GeoDataArt #GeoSpectralArt #Sudan #Copernicus #CopernicusSentinel

False-color PCA composite from Sentinel-1 and Sentinel-2 data showing vivid contrasts in lithology and surface materials in a desert region of Sudan. Bright reds, greens, blues, and purples highlight drainage networks, bedrock structures, and geomorphological boundaries.
2025-11-19

#Copernicus Image of the day
Offshore wind farms in the North Sea

Credit: European Union, Copernicus Sentinel-1 imagery

Source: copernicus.eu/en/media/image-d

#Sentinel1 #EU #EarthObservation

Copernicus Image of the day: Offshore wind farms in the North Sea

Credit: European Union, Copernicus Sentinel-1 imagery
2025-11-19

Result of a Principal Component Analysis (PCA) based on combined median composites of Sentinel-1 and Sentinel-2 satellite imagery — somewhere in the desert of Sudan.

The PCA highlights contrasts between different lithologies, structural domains, and surface materials, revealing subtle geological features that are hard to distinguish in standard RGB composites.

And yes — it also looks simply beautiful.

#RemoteSensing #EarthObservation #Geology #PCA #Sentinel1 #Sentinel2 #Radar #OpenData #GIS #QGIS #Geomorphology #Geoscience #SAR #SAGAGIS #RStats #Desert #Lithology #GeoDataArt #GeoSpectralArt

Result of a Principal Component Analysis (PCA) based on combined median composites of Sentinel-1 and Sentinel-2 imagery
2025-11-15

Day15 #30daymapchallenge is Fire 🔥
My map is a gif of #Sentinel1 images before & after the #wildfire at Winter Hill in the West Pennine Moors, UK in 2018.
The dashed line shows the extent of the fire, which burned on dry #peatland for over 40 days.
The colour range from blue to orange symbolises how radar backscatter represents water bodies/wetter surfaces through to dry, impermeable land cover & demonstrates the positive effects of #peatlandrestoration works since the fire.
All using #qgis

2025-11-14

My experiment with land-cover classification for Calgary using satellite imagery and with a machine-learning model trained on data from another continent.

The results turned out surprisingly good — most classes transferred almost perfectly.
The only noticeable shift was the Forest class: tree and shrub vegetation in the source region differs from Calgary’s, so the model mapped it conservatively here.

Still, the general structure of the landscape was captured very well, and community-level land-cover profiles look consistent.

#Rstats #RemoteSensing #GIS #MachineLearning #LandCover #Calgary #EarthObservation #LULC #GreennessOfCalgary #QGIS #UrbanHealth #Alberta #Canada #Sentinel #Copernicus #CopernicusSentinel #Sentinel1 #Sentinel2 #ESA #DataScience #FOSS #UrbanEcology #UrbanNature

Land-cover classification for Calgary (Forest, Grass, Mixed, Park, Solid, Water).Proportions of land-cover classes within the Glenmore Park community.Land-cover structure for the Royal Oak community.Land-cover distribution for the Oakridge community.
2025-11-13

This is what I found when analysing the effect of temperature to delineate #peatland using #Sentinel1.
These images were only 23 days apart in the 2022/23 winter in the West Pennine Moors, but demonstrate differences in backscatter because of temperature. Our research found S1 images in frozen conditions could better delineate peatland & show differences in wetness of this habitat.
Check it out here mdpi.com/2072-4292/17/16/2752
Get in touch if I can help your project
#qgis
#mapping #geospatial

geo-spatial.orggeospatialorg
2025-11-05

🛰️ Sentinel-1D joins the Copernicus constellation!

Launched on 4 November at 22:02 CET aboard an Ariane 6 rocket from Europe’s Spaceport in French Guiana, Sentinel-1D completes the first generation of radar satellites within the Copernicus Sentinel-1 mission. 🚀

Providing high-resolution SAR images of Earth — day or night, in any weather — Sentinel-1 supports disaster response, environmental monitoring, maritime safety, and climate science worldwide. 🌍✨

#DLR:
"
Neuzugang fĂĽr das Copernicus-Erdbeobachtungsprogramm
"
".. Die Deutsche Raumfahrtagentur im DLR begleitet das Programm im Auftrag des Bundes.
DLR-Institute unterstĂĽtzen bei der Kalibrierung der Radarinstrumente. .."

dlr.de/de/aktuelles/nachrichte

5.11.2025

#Copernicus #EO #EOC #Erdbeobachtung #Fernerkundung #GMES #Oberpfaffenhofen #Raumfahrt #SAR #Satelliten #Sentinel1 #Sentinel1D #SpaceFlight

#Arianespace:
"
Arianespace bringt mit Ariane 6 den Copernicus-Satelliten Sentinel-1D erfolgreich in seine Umlaufbahn
"
".. Die Mission VA265 ist der dritte kommerzielle Flug der europäischen Schwerlastrakete Ariane 6.
.. erfüllt seine Verpflichtung, Europa einen autonomen Zugang zum Weltraum zu gewährleisten. .."

newsroom.arianespace.com/arian

4.11.2025

#Ariane6 #Copernicus #EO #Erdbeobachtung #Fernerkundung #GMES #Kourou #Raumfahrt #Satelliten #Sentinel1 #Sentinel1D #SpaceFlight #VA265

#ESA:
"
Copernicus Sentinel-1D erreicht mit Ariane 6 seine Umlaufbahn
"
".. Der Start erfolgte am Dienstag, dem 4. November, um 22:02 Uhr MEZ (18:02 Uhr Ortszeit) an Bord einer Ariane-6-Trägerrakete vom europäischen Weltraumbahnhof in Französisch-Guayana. .."

esa.int/Newsroom/Press_Release

4.11.2025

#Ariane6 #Copernicus #EO #Erdbeobachtung #Fernerkundung #GMES #Raumfahrt #SAR #Satelliten #Sentinel1 #Sentinel1D #SpaceFlight #VA265

2025-10-23

We found some interesting visuals illustrating how well #wildfire damage can be #mapped with #remotesensing when Dr Daniel Hölbling & I undertook a project on the potential of #Sentinel1 to delineate #peatland.
This animation shows in the lined area the effects of the 2018 Winter Hill wildfire in Lancashire & #peatlandrestoration works since.
Our research lnkd.in/eaPpipQu
For further peatland mapping research/other nature-based solutions please contact me.
All using the power of #qgis

Olivier D'Hondt 🛰️🌍🌱tyldurd@framapiaf.org
2025-10-08

It's a small thing but adding the number of products in ( ) for each group in the dropdown menu makes it easier to find #InSAR pairs. I'll add that in the next version.
#EOTools #RemoteSensing #EarthObservation #python #FOSS #Sentinel1

2025-10-03

My first time at the @osgeouk #foss4guk2025 conference in #Leeds this week. I really recommend anyone attending the next one.
It inspired me to highlight how #opendata #sentinel1 satellite imagery is a valuable resource for #environmental monitoring.
I applied this resource to #peatland using #qgis & was published in the @mdpiopenaccess Remote Sensing journal mdpi.com/2072-4292/17/16/2752
With zero funding resources, all of this was possible because of #opendata & #opensourcegis.
#earthobservation

Olivier D'Hondt 🛰️🌍🌱tyldurd@framapiaf.org
2025-10-01

🛰️ I’m currently experimenting with combining the Copernicus STAC and S3 APIs to make the EO-Tools Sentinel-1 processing chain leaner and more efficient.
The idea is to avoid downloading full products when only a subset of bursts is needed.

I know the total monthly bandwidth allowance, but does anyone know if there’s a way to check how much bandwidth remains after using the API?

#Sentinel1 #SAR #STAC #Copernicus #EarthObservation #RemoteSensing #InSAR #OpenSource #EOTools

Olivier D'Hondt 🛰️🌍🌱tyldurd@framapiaf.org
2025-09-11

Taking some time to improve Enhanced Spectral Diversity in EO-Tools. New version in the pipes!

#python #EarthObservation #RemoteSensing #SyntheticApertureRadar #Sentinel1

Client Info

Server: https://mastodon.social
Version: 2025.07
Repository: https://github.com/cyevgeniy/lmst