#AirQuality

NOAA HRRR smoke forecast CONUSnoaa_hrrr_smoke_forecast_bot@envismo.social
2026-02-26

Near surface smoke forecast for the CONUS area, starting:

Feb 26 2026 - 00:00 PST
Feb 26 2026 - 03:00 EST

Model run: 20260226T08:00 UTC

Data from NOAA's HRRR CONUS (rapidrefresh.noaa.gov/hrrr/)

Note that this product comes with absolutely no guarantee of availability, accuracy or completeness.

Always consult with your trusted local weather provider before using the information presented here.
#Wildfires #AirQuality

NOAA HRRR smoke forecast CONUSnoaa_hrrr_smoke_forecast_bot@envismo.social
2026-02-26

Near surface smoke forecast for the CONUS area, starting:

Feb 25 2026 - 21:00 PST
Feb 26 2026 - 00:00 EST

Model run: 20260226T05:00 UTC

Data from NOAA's HRRR CONUS (rapidrefresh.noaa.gov/hrrr/)

Note that this product comes with absolutely no guarantee of availability, accuracy or completeness.

Always consult with your trusted local weather provider before using the information presented here.
#Wildfires #AirQuality

2026-02-26

Fire-induced health impacts by the Forestry Corporation of NSW Pt 2

Negative externalities occur when the consumption or production of a commodity causes a harmful effect to a third party.

Bushfire smoke: There is no safe level of exposure. >
theconversation.com/how-to-pro

Hundreds died from the effects of smoke inhalation caused by Australia’s 2019-2020 black summer bushfires and many more are likely to have long-term health issues." >
theguardian.com/environment/20

"Breathing polluted air may do more than harm your lungs — it could also increase your risk of Alzheimer’s disease." >
sciencedaily.com/releases/2026

Fire-induced health impacts by the Forestry Corporation of NSW Pt 1 >
mastodon.au/@Bellingen/1161346

#Pollution #Smoke #HealthHazards #FCNSW #forestry #harm #TheGreatkoalaNationalPark #PineCreekStateForest #TuckersNobSF #Bellingenshire #Gleniffer #NSW #EPA #COPD #AirQuality #SacrificeZone #extractivism #LoggingIndustry #NegativeExternalities #governance

Image: Forestry Corporation signage: Smoke Hazard, Roses Rd., Gleniffer

NOAA HRRR smoke forecast CONUSnoaa_hrrr_smoke_forecast_bot@envismo.social
2026-02-26

Near surface smoke forecast for the CONUS area, starting:

Feb 25 2026 - 18:00 PST
Feb 25 2026 - 21:00 EST

Model run: 20260226T02:00 UTC

Data from NOAA's HRRR CONUS (rapidrefresh.noaa.gov/hrrr/)

Note that this product comes with absolutely no guarantee of availability, accuracy or completeness.

Always consult with your trusted local weather provider before using the information presented here.
#Wildfires #AirQuality

2026-02-26

Fire-induced health impacts by the Forestry Corporation of NSW Pt 1

The state-owned Forestry Corporation of NSW (FCNSW) is doing ‘Planned Burns’ to the unwanted left-overs after logging and clear felling Tuckers Nob State Forests. The so-called ‘plantations’ or cellulose factory is or was a rich bio-diverse ecosystem before the destruction.

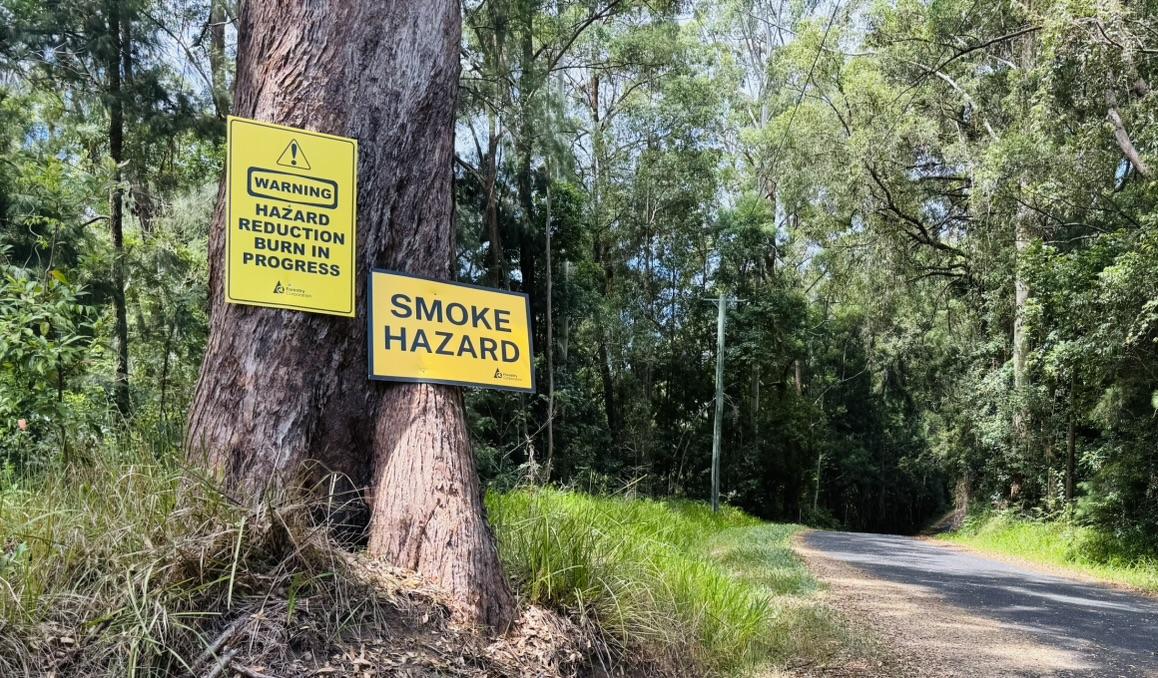
Many residents live in the area and wildlife has moved back into the sprouting desert.The area has been declared a ‘hazard’ and 36 ha are being incinerated. They call it ‘Hazard Reduction’ because they have dried out the microclimate and increased the bushfire risk.

Through a government decision and outmoded management practices every living being with a lung is now being wilfully exposed to toxic smoke from incineration.
It is not bushfire smoke from climate disruption, but an intentional collateral to extracting cellulose from bio-diversity which has to be subsidised by tax payers. This is turning the area and the breathing beings into a sacrifice zone.

The air-filled sacs in the lungs, the alveoli are forced to act as a cost-effective vacuum cleaner for forestry’s “Hazard Reduction” fallout, cleaning up their ‘debris’.

There are no health warnings issued. The reduced air quality leads to exposure to bushfire smoke. Fire-induced health impacts lead to mortalities from particulate matter, increased cardio-respiratory hospital admissions and chronic obstructive pulmonary diseases.

Roses Road 5km NW of Bellingen, Planned Burn, Forestry HR Tuckers Nob Plantation 26 & 27 > abc.net.au/emergency/warning/A

"Fine particles, often described as PM2.5 (particles of 2.5 micrometres in diameter or less). These particles can remain suspended in the air for extended periods and, owing to their tiny size, can penetrate deep into the lungs when inhaled." > theconversation.com/bushfires-

#Pollution #Smoke #HealthHazards #FCNSW #forestry #harm #Bellingenshire #Gleniffer #NSW #COPD #AirQuality #breathing
Image: Respiratory system, Wikipedia Commons

2026-02-26

@localhaze

It looks like street-by-street air-pollution data isn't available just to view. It's not totally clear, but it seems you have to sign up to see the pollution data, but signing up involves putting a sensor on your bike, and they don't accept just anyone; they want geographic dispersion.

Long story short: This air-pollution data is not available for Santander sharebike cyclists to view. 😦

#cycling #bike #bicycle #sharebike #BikeHire #Santander #TfL #pollution #AirPollution #AirQuality #health #asthma

NOAA HRRR smoke forecast CONUSnoaa_hrrr_smoke_forecast_bot@envismo.social
2026-02-26

Near surface smoke forecast for the CONUS area, starting:

Feb 25 2026 - 15:00 PST
Feb 25 2026 - 18:00 EST

Model run: 20260225T23:00 UTC

Data from NOAA's HRRR CONUS (rapidrefresh.noaa.gov/hrrr/)

Note that this product comes with absolutely no guarantee of availability, accuracy or completeness.

Always consult with your trusted local weather provider before using the information presented here.
#Wildfires #AirQuality

Local Hazelocalhaze
2026-02-25

Saddle Sense started as a King's College London dissertation and is now collecting nearly 1M data points from bike-mounted air quality sensors across London. The result? Street-by-street air pollution maps that help cyclists cut their exposure by 20-70%.
This is what citizen science looks like in practice: kcl.ac.uk/saddle-sense-real-ti

Bicycling Monterey 💚🌎🌍🌏bikemonterey@sfba.social
2026-02-25

"About 12 percent of Monterey County’s oil and gas wells are located within 200 feet of a river or creek. This includes the Salinas River, which runs through the San Ardo oil field, and is a critical source of the county’s groundwater.

"In December 2025, over 4,000 gallons of oil and toxic wastewater spilled in the San Ardo oil field, just over a mile from where the Sargent Creek feeds the Salinas River. It is unconfirmed whether that spill was connected to an active or idle well.”
—Katie Rodriguez, #MontereyCountyNow
#BigOil #Chevron #AeraEnergy #CaliforniaResourcesCorporation #MontereyCounty #Water #Air #CenterForBiologicalDiversity #AirQuality #WaterQuality #Groundwater #Oil #DesertedOilWells #SalinasValley #SanArdo

montereycountynow.com/news/loc

air tweets - cannstattaschuma@mastodon.online
2026-02-25

DAILY AIR QUALITY UPDATE

#Feinstaub in #Cannstatt / #Stuttgart (25.02.2026 20:06 CET)

PM10: 2.6 µg/m³
PM2.5: 1.7 µg/m³

Details: maps.sensor.community/#15/48.8

This is a bot. Code is available on github aschuma/air_tweets.

#Luftverschmutzung #Particulatematter #Opendata #Civictech #Airrohr #Airpollution #Airquality

NOAA HRRR smoke forecast CONUSnoaa_hrrr_smoke_forecast_bot@envismo.social
2026-02-25

Near surface smoke forecast for the CONUS area, starting:

Feb 25 2026 - 09:00 PST
Feb 25 2026 - 12:00 EST

Model run: 20260225T17:00 UTC

Data from NOAA's HRRR CONUS (rapidrefresh.noaa.gov/hrrr/)

Note that this product comes with absolutely no guarantee of availability, accuracy or completeness.

Always consult with your trusted local weather provider before using the information presented here.
#Wildfires #AirQuality

NOAA HRRR smoke forecast CONUSnoaa_hrrr_smoke_forecast_bot@envismo.social
2026-02-25

Near surface smoke forecast for the CONUS area, starting:

Feb 25 2026 - 03:00 PST
Feb 25 2026 - 06:00 EST

Model run: 20260225T11:00 UTC

Data from NOAA's HRRR CONUS (rapidrefresh.noaa.gov/hrrr/)

Note that this product comes with absolutely no guarantee of availability, accuracy or completeness.

Always consult with your trusted local weather provider before using the information presented here.
#Wildfires #AirQuality

NOAA HRRR smoke forecast CONUSnoaa_hrrr_smoke_forecast_bot@envismo.social
2026-02-25

Near surface smoke forecast for the CONUS area, starting:

Feb 25 2026 - 00:00 PST
Feb 25 2026 - 03:00 EST

Model run: 20260225T08:00 UTC

Data from NOAA's HRRR CONUS (rapidrefresh.noaa.gov/hrrr/)

Note that this product comes with absolutely no guarantee of availability, accuracy or completeness.

Always consult with your trusted local weather provider before using the information presented here.
#Wildfires #AirQuality

NOAA HRRR smoke forecast CONUSnoaa_hrrr_smoke_forecast_bot@envismo.social
2026-02-25

Near surface smoke forecast for the CONUS area, starting:

Feb 24 2026 - 21:00 PST
Feb 25 2026 - 00:00 EST

Model run: 20260225T05:00 UTC

Data from NOAA's HRRR CONUS (rapidrefresh.noaa.gov/hrrr/)

Note that this product comes with absolutely no guarantee of availability, accuracy or completeness.

Always consult with your trusted local weather provider before using the information presented here.
#Wildfires #AirQuality

NOAA HRRR smoke forecast CONUSnoaa_hrrr_smoke_forecast_bot@envismo.social
2026-02-25

Near surface smoke forecast for the CONUS area, starting:

Feb 24 2026 - 18:00 PST
Feb 24 2026 - 21:00 EST

Model run: 20260225T02:00 UTC

Data from NOAA's HRRR CONUS (rapidrefresh.noaa.gov/hrrr/)

Note that this product comes with absolutely no guarantee of availability, accuracy or completeness.

Always consult with your trusted local weather provider before using the information presented here.
#Wildfires #AirQuality

air tweets - cannstattaschuma@mastodon.online
2026-02-24

⚠️ #Feinstaubalarm in #Cannstatt / #Stuttgart (25.02.2026 00:15 CET)

The hourly average of the Cannstatt Seelberg #PM10 sensor has exceeded 50 µg/m³.

PM10: 59.8 µg/m³
PM2.5: 20.2 µg/m³

Details: maps.sensor.community/#15/48.8


#Feinstaub #Luftverschmutzung #Particulatematter #Opendata #Civictech #Airrohr #Airpollution #Airquality

2026-02-24

#Irony: we got down to fair #airquality because all the #cars are buried, yet as soon as they start shoveling we will go back to poor or unhealthy #AQI
accuweather.com/en/us/park-slo #brooklyn #climate #parkslope

air tweets - cannstattaschuma@mastodon.online
2026-02-24

DAILY AIR QUALITY UPDATE

#Feinstaub in #Cannstatt / #Stuttgart (24.02.2026 20:06 CET)

PM10: 8.5 µg/m³
PM2.5: 7.3 µg/m³

Details: maps.sensor.community/#15/48.8

This is a bot. Code is available on github aschuma/air_tweets.

#Luftverschmutzung #Particulatematter #Opendata #Civictech #Airrohr #Airpollution #Airquality

NOAA HRRR smoke forecast CONUSnoaa_hrrr_smoke_forecast_bot@envismo.social
2026-02-24

Near surface smoke forecast for the CONUS area, starting:

Feb 24 2026 - 09:00 PST
Feb 24 2026 - 12:00 EST

Model run: 20260224T17:00 UTC

Data from NOAA's HRRR CONUS (rapidrefresh.noaa.gov/hrrr/)

Note that this product comes with absolutely no guarantee of availability, accuracy or completeness.

Always consult with your trusted local weather provider before using the information presented here.
#Wildfires #AirQuality

NOAA HRRR smoke forecast CONUSnoaa_hrrr_smoke_forecast_bot@envismo.social
2026-02-24

Near surface smoke forecast for the CONUS area, starting:

Feb 24 2026 - 06:00 PST
Feb 24 2026 - 09:00 EST

Model run: 20260224T14:00 UTC

Data from NOAA's HRRR CONUS (rapidrefresh.noaa.gov/hrrr/)

Note that this product comes with absolutely no guarantee of availability, accuracy or completeness.

Always consult with your trusted local weather provider before using the information presented here.
#Wildfires #AirQuality

Client Info

Server: https://mastodon.social
Version: 2025.07
Repository: https://github.com/cyevgeniy/lmst