NetBlocks

The Internet's Observatory: Tracking cybersecurity and digital governance • connectivity and democracy • tools and policy for change • contact@netblocks.org

NetBlocksnetblocks
2026-02-05

⚠️ Update: With Kharkiv, , once again in the midst of power outages following Russian attacks on energy infrastructure, network data show a worsening cycle of disruptions corresponding to energy supply issues leaving residents without heat in freezing winter conditions

Graph from NetBlocks showing network connectivity by region in Ukraine from January 24, 2026, to February 5, 2026. The y-axis shows normalized connectivity from 0% to 100%, and the x-axis shows dates. The green line representing Kharkiv's connectivity remains lower than normal most of the time period due to scheduled shutdowns, with a sharp drop on the morning of February 5. The drop in connectivity aligns with power cuts due to drone and missile attacks from Russia. The minimum and current connectivity levels are shown as 46% and 60%, respectively. The chart has a dark background with a red circle highlighting the decline at the end of the period and includes the NetBlocks logo in the lower left corner.
NetBlocksnetblocks
2026-02-01

ℹ️ Note: Social media platform X (formerly Twitter) is currently experiencing international outages; incident not related to country-level internet disruptions or filtering

Screenshot of the X (formerly Twitter) social media platform showing a message that reads 'Posts aren't loading right now, Try again' with an option to 'Retry' underneath.
NetBlocksnetblocks
2026-02-01

“The internet is that last shred of hope because, in the darkness of a blackout, anything can happen and nobody will know.”

In 's digital darkness it's unlikely anyone really knows what damage the regime has wrought.

🖋️ Fintan Hogan writes for The Sunday Times, asking whether it can happen in the UK

thetimes.com/uk/technology-uk/

NetBlocksnetblocks
2026-01-31

⚠️ Confirmed: Metrics show a drop in internet connectivity in , also impacting , corroborating energy company Ukrenergo's statement detailing a system-wide power emergency involving the disconnection of high-voltage international transmission lines 🔌

There are two graphs in the photo. Graph from NetBlocks showing network connectivity in Ukraine from January 27, 2026, to January 31, 2026. The y-axis represents normalized connectivity, ranging from 0% to 100%, and the x-axis represents the dates. The green line representing Ukraine's connectivity remains normal most of the time period, with a drop on the morning of January 31. The drop in connectivity aligns with a power cut. The minimum and current connectivity levels are indicated as 85% and 86%, respectively. The chart has a dark background with a red circle highlighting the decline at the end of the period.

Graph from NetBlocks showing network connectivity in Moldova from January 27, 2026, to January 31, 2026. The y-axis represents normalized connectivity, ranging from 0% to 100%, and the x-axis represents the dates. The green line representing Moldova's connectivity remains normal most of the time period, with a drop on the morning of January 31. The drop in connectivity aligns with a power cut originated in Ukraine. The minimum and current connectivity levels are indicated as 70% and 70%, respectively. The chart has a dark background with a red circle highlighting the decline at the end of the period.
NetBlocksnetblocks
2026-01-30

🗓️ It's Friday evening in where internet remains heavily filtered 22 full days after the blackout as whitelisting and intermittent connectivity continue to limit Iranians' contact with the outside world. Networks are visible internationally but broadly restricted.

Graph from NetBlocks showing network connectivity in Iran from January 2, 2026, to January 30, 2026. The y-axis represents normalized connectivity from 0% to 100%, and the x-axis represents dates. The green line representing Iran's connectivity remains normal most of the time period, with a sharp drop on the evening of January 8, when connectivity falls from above 90% to near zero. Connectivity remains almost entirely offline for an extended period, with only minimal and sporadic activity, before a partial restoration appears at the end of the period on January 27 under heavy filtering. A red horizontal arrow labelled “SHUTDOWN” marks the duration of the disruption, with an annotation on the top right reading “filtered intermittent connectivity.” The disruption aligns with a nationwide internet shutdown imposed by authorities amid unrest. The minimum and current connectivity levels are shown as 1% and 95%, respectively. The chart has a dark background and includes the NetBlocks logo in the lower left corner.
NetBlocksnetblocks
2026-01-29

@boud Definitely. Tigray is among the most harmful authoritarian subnational shutdowns in our records, and Ethiopia more generally has been a perpetrator of systematic digital repression over the years.
netblocks.org/reports/internet

NetBlocksnetblocks
2026-01-29

🗓️ Exactly three weeks ago imposed a national internet blackout to obscure civilian killings. Whitelisting and heavy filtering are still in effect.

The incident is among the most severe of its kind on record, exceeded in duration only during civil war in Myanmar and Sudan.

Graph from NetBlocks showing network connectivity in Iran from January 2, 2026, to January 29, 2026. The y-axis represents normalized connectivity from 0% to 100%, and the x-axis represents dates. The green line representing Iran's connectivity remains normal most of the time period, with a sharp drop on the evening of January 8, when connectivity falls from above 90% to near zero. Connectivity remains almost entirely offline for an extended period, with only minimal and sporadic activity, before a partial restoration appears at the end of the period on January 27 under heavy filtering. A red horizontal arrow labelled “SHUTDOWN” marks the duration of the disruption, with an annotation on the top right reading “filtered intermittent connectivity.” The disruption aligns with a nationwide internet shutdown imposed by authorities amid unrest. The minimum and current connectivity levels are shown as 1% and 95%, respectively. The chart has a dark background and includes the NetBlocks logo in the lower left corner.
NetBlocksnetblocks
2026-01-28

⚠️ Update: 20 full days after imposed a national internet blackout, most ordinary users still face heavy filtering and intermittent service under a whitelist system despite a significant increase in internationally visible networks and datacenters.

Graph from NetBlocks showing network connectivity in Iran from January 2, 2026, to January 28, 2026. The y-axis represents normalized connectivity from 0% to 100%, and the x-axis represents dates. The green line representing Iran's connectivity remains normal most of the time period, with a sharp drop on the evening of January 8, when connectivity falls from above 90% to near zero. Connectivity remains almost entirely offline for an extended period, with only minimal and sporadic activity, before a partial restoration appears at the end of the period on January 27 under heavy filtering. A red horizontal arrow labelled “SHUTDOWN” marks the duration of the disruption, with an annotation on the top right reading “filtered intermittent connectivity.” The disruption aligns with a nationwide internet shutdown imposed by authorities amid unrest. The minimum and current connectivity levels are shown as 1% and 95%, respectively. The chart has a dark background and includes the NetBlocks logo in the lower left corner.
NetBlocksnetblocks
2026-01-27

⚠️ Update: With 's internet shutdown approaching day 20, many networks are becoming visible internationally.

HOWEVER:

📵 No return to usual: Web still heavily filtered on a whitelist basis.
🔧 Circumvention still needed: The opening of protocols can enable new workarounds.

Graph from NetBlocks showing network connectivity in Iran from January 2, 2026, to January 27, 2026. The y-axis represents normalized connectivity from 0% to 100%, and the x-axis represents dates. The green line representing Iran's connectivity remains normal most of the time period, with a sharp drop on the evening of January 8, when connectivity falls from above 90% to near zero. Connectivity remains almost entirely offline for an extended period, with only minimal and sporadic activity, before a limited restoration appears at the end of the period on January 27 under heavy filtering. A red horizontal arrow labelled “SHUTDOWN” marks the duration of the disruption, with an annotation on the right reading “Heavily filtered intermittent connectivity.” The disruption aligns with a nationwide internet shutdown imposed by authorities amid unrest. The minimum and current connectivity levels are shown as 1% and 84%, respectively. The chart has a dark background and includes the NetBlocks logo in the lower left corner.
NetBlocksnetblocks
2026-01-26

⚠️ Confirmed: Network data show a disruption to internet connectivity in Kharkiv, , following a combined UAV and heavy rocket artillery assault by Russia targeting energy infrastructure

Graph from NetBlocks showing network connectivity by region in Ukraine from January 20, 2026, to January 26, 2026. The y-axis shows normalized connectivity from 0% to 100%, and the x-axis shows dates. The green line representing Kharkiv's connectivity remains lower than normal most of the time period due to scheduled shutdowns. A red horizontal arrow labelled “Scheduled power cuts” spans January 21 to January 24, indicating recurring connectivity reductions linked to planned electricity outages. Toward the end of the timeline on January 26, a sharp drop in connectivity is highlighted with a red circle and labelled “Attack,” indicating a sudden disruption consistent with an energy or infrastructure strike. The minimum and current connectivity levels are shown as 50% and 65%, respectively. The chart has a dark background and includes the NetBlocks logo in the lower left corner.
NetBlocksnetblocks
2026-01-26

⚠️ Update: 's internet blackout continues through its 18th day, obscuring the extent of a deadly crackdown on civilians.

Meanwhile, gaps in the filternet are being tightened to limit circumvention while whitelisted regime accounts promote the Islamic Republic's narrative.

Graph from NetBlocks showing network connectivity in Iran from January 2, 2026 to January 26, 2026. The y-axis represents normalized connectivity, ranging from 0% to 100%, and the x-axis represents the dates. The green line representing Iran's observable internet connectivity, with a sharp drop on the evening of January 8 from high levels to near zero and only a short-lasting recovery on the morning of January 24. The drop in connectivity aligns with an internet shutdown imposed by authorities during protests across the nation. The minimum and current connectivity levels are indicated as 1% and 1%, respectively. The chart has a dark background with a red horizontal arrow labeled 'SHUTDOWN' indicating the period of disruption, which is ongoing.
NetBlocksnetblocks
2026-01-25

⚠️ Update: Further internet outages have been tracked in as Winter Storm Fern brings subzero temperatures, with snow and ice accumulation snapping tree branches and power lines, leaving over 300,000 residents without electricity and communications 🧊

Graph from NetBlocks showing network connectivity by region in United States from January 20, 2026, to January 25, 2026. The y-axis represents normalized connectivity, ranging from 0% to 100%, and the x-axis represents the dates. The graph indicates connectivity disruptions in Tennessee starting on the early morning of January 25. The drop in connectivity aligns with power cuts due to freezing winter storms. The chart has a dark background and connectivity lines for each city are color-coded. Jasper, Tennessee (0% / 0%), McKenzie, Tennessee (0% / 0%), Savannah, Tennessee (9% / 9%), Clarksville, Tennessee (20% / 20%), Jackson, Tennessee (47% / 50%), Antioch, Tennessee (53% / 60%), Columbia, Tennessee (58% / 63%), Brentwood, Tennessee (60% / 65%), Nashville, Tennessee (62% / 65%), Hendersonville, Tennessee (67% / 74%), Franklin, Tennessee (70% / 75%), Mount Juliet, Tennessee (76% / 77%), Lebanon, Tennessee (79% / 79%), Murfreesboro, Tennessee (79% / 81%), Atoka, Tennessee (75% / 88%)
NetBlocksnetblocks
2026-01-25

⚠️ Update: Metrics show a steady decline in internet connectivity in parts of Tennessee and Mississippi as Winter Storm Fern encroaches more of the eastern United States, with outages attributed to direct impacts of the storm on power and telecoms infrastructure ❄️

Graph from NetBlocks showing network connectivity by region in United States from January 20, 2026, to January 25, 2026. The y-axis represents normalized connectivity, ranging from 0% to 100%, and the x-axis represents the dates. The graph indicates connectivity disruptions in Tennessee and Mississippi starting on the early morning of January 25. The drop in connectivity aligns with power cuts due to freezing winter storms. The chart has a dark background and connectivity lines for each city are color-coded. Iuka, Mississippi (0% / 0%), Savannah, Tennessee (9% / 9%), New Albany, Mississippi (15% / 15%), Oxford, Mississippi (15% / 23%), Pontotoc, Mississippi (40% / 40%), Hermanville, Mississippi (43% / 43%), Corinth, Mississippi (43% / 43%), Fulton, Mississippi (63% / 63%), Tupelo, Mississippi (68% / 68%), McKenzie, Tennessee (74% / 74%), Atoka, Tennessee (75% / 75%), Amory, Mississippi (80% / 80%), Nashville, Tennessee (81% / 81%), Brentwood, Tennessee (82% / 82%), Antioch, Tennessee (84% / 84%), Covington, Tennessee (87% / 87%), Franklin, Tennessee (87% / 87%), Jackson, Tennessee (88% / 88%), Murfreesboro, Tennessee (88% / 88%)
NetBlocksnetblocks
2026-01-25

ℹ️ Update: Internet connectivity in Greenland has returned to ordinary levels after the reconnection of electricity, following an overnight disruption to power transmission lines amid strong winds that left capital city in the dark; incident duration ~6 hours 📈

Graph from NetBlocks showing network connectivity in Greenland from January 17, 2026, to January 25, 2026. The y-axis represents normalized connectivity, ranging from 0% to 100%, and the x-axis represents the dates. The green line representing Greenland's connectivity remains normal most of the time period, with a sharp drop on the night of January 24. The drop in connectivity aligns with a power cut. Near total recovery is now visible. The minimum and current connectivity levels are indicated as 73% and 99%, respectively. The chart has a dark background.
NetBlocksnetblocks
2026-01-25

RE: mastodon.social/@netblocks/115

🗓️ 17 days after introduced an internet blackout to mask a deadly crackdown:

- minimal whitelisted service available to some users
- circumvention allows messages to get through
- brief connectivity spikes give false impression of wider restoration

The shutdown continues.

NetBlocksnetblocks
2026-01-25

400 hours.

Graph from NetBlocks showing network connectivity in Iran from January 2, 2026 to January 25, 2026. The y-axis represents normalized connectivity, ranging from 0% to 100%, and the x-axis represents the dates. The green line representing Iran's observable internet connectivity, with a sharp drop on the evening of January 8 from high levels to near zero and only a short-lasting recovery on the morning of January 24. The drop in connectivity aligns with an internet shutdown imposed by authorities during protests across the nation. The minimum and current connectivity levels are indicated as 1% and 1%, respectively. The chart has a dark background with a red horizontal arrow labeled 'SHUTDOWN' indicating the period of disruption, which is ongoing.
NetBlocksnetblocks
2026-01-25

ℹ️ Update: Internet connectivity in remains diminished due to an ongoing power cut, as initial attempts to repair transmission lines from Buksefjord hydroelectric plant fail amid strong winds, triggering a transfer to emergency power per energy company Nukissiorfiit.

Graph from NetBlocks showing network connectivity in Greenland from January 17, 2025, to January 25, 2025. The y-axis represents normalized connectivity, ranging from 0% to 100%, and the x-axis represents the dates. The green line representing Greenland's connectivity remains normal most of the time period, with a sharp drop on the night of January 24. The drop in connectivity aligns with a power cut. A modest recovery is now visible. The minimum and current connectivity levels are indicated as 73% and 84%, respectively. The chart has a dark background.
NetBlocksnetblocks
2026-01-25

⚠️ Confirmed: Metrics show a significant decline to internet connectivity in with high impact to capital Nuuk. The incident comes amid reports of a city-wide power outage attributed by energy company Nukissiorfiit to an "accident" 🔌

Graph from NetBlocks showing network connectivity in Greenland from January 17, 2025, to January 25, 2025. The y-axis represents normalized connectivity, ranging from 0% to 100%, and the x-axis represents the dates. The green line representing Greenland's connectivity remains normal most of the time period, with a sharp drop on the night of January 24. The drop in connectivity aligns with a power cut. The minimum and current connectivity levels are indicated as 73% and 74%, respectively. The chart has a dark background with a red circle highlighting the decline at the end of the period.
NetBlocksnetblocks
2026-01-24

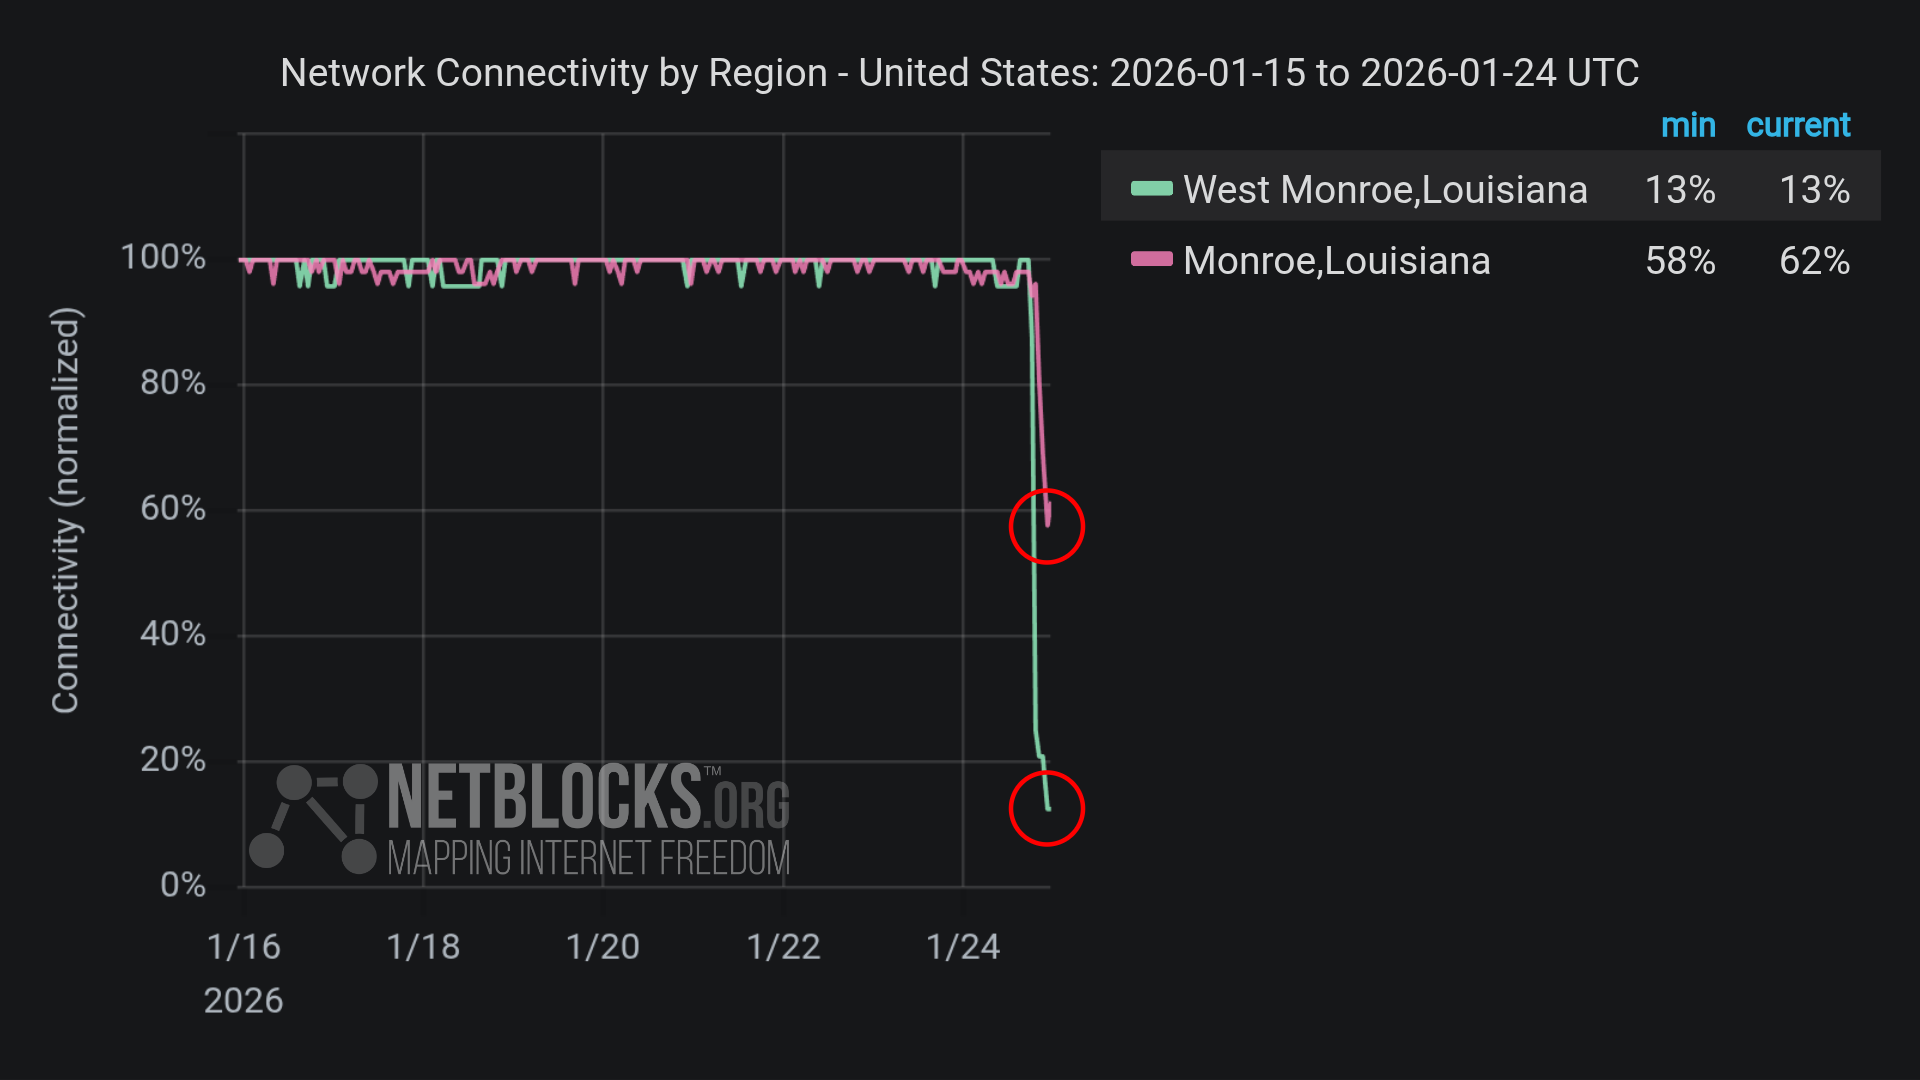
⚠️ Confirmed: Network data show a decline in internet connectivity in with high impact to Monroe, attributed to power outages and damaged lines as freezing winter storms start to descend on the eastern US 🌨️

Graph from NetBlocks showing network connectivity by region in United States from January 15, 2025, to January 24, 2025. The y-axis represents normalized connectivity, ranging from 0% to 100%, and the x-axis represents the dates. The graph indicates connectivity disruptions in Louisiana starting on the afternoon of January 24. The drop in connectivity aligns with power cuts due to freezing winter storms. The chart has a dark background with two red circles highlighting the decline at the end of the period. West Monroe, Louisiana (13% / 13%), Monroe, Louisiana (58% / 62%)
NetBlocksnetblocks
2026-01-24

⚠️ Update: 's internet blackout continues in its third week despite a brief momentary restoration of international connectivity around hour 375. Online platforms are occasionally whitelisted and some users have been able to tunnel out over the last couple of days.

Graph from NetBlocks showing network connectivity in Iran from January 2, 2025, to January 24, 2025. The y-axis represents normalized connectivity, ranging from 0% to 100%, and the x-axis represents the dates. The green line representing Iran's connectivity remains lower than normal most of the time period due to protests, with a sharp drop on the evening of January 8 and a very brief recovery on the morning of January 24. The drop in connectivity aligns with protests across the nation. The minimum and current connectivity levels are indicated as 1% and 1%, respectively. The chart has a dark background with a red horizontal arrow labeled 'SHUTDOWN', indicates the period of disruption, an orange circle highlighting the brief recovery with a label 'BRIEF RESTORATION' and an orange horizontal arrow labeled 'TUNNELING', incidates some users' ability to use circumvention tools.

Client Info

Server: https://mastodon.social
Version: 2025.07
Repository: https://github.com/cyevgeniy/lmst